What your AI investment returns.
Vantage is the leadership view of Journi DevOS. The value AI actually returns, the delivery it moves, and the sessions worth a look — rolled up across every team, measured against your own baseline, in your own numbers.
The value, not just the spend.
Usage dashboards show what you spent. Vantage shows what you got for it: every saving priced against a no-DevOS baseline and rolled up across teams — net value, percentage saved, throughput and adoption, with the sessions worth a look flagged in place.
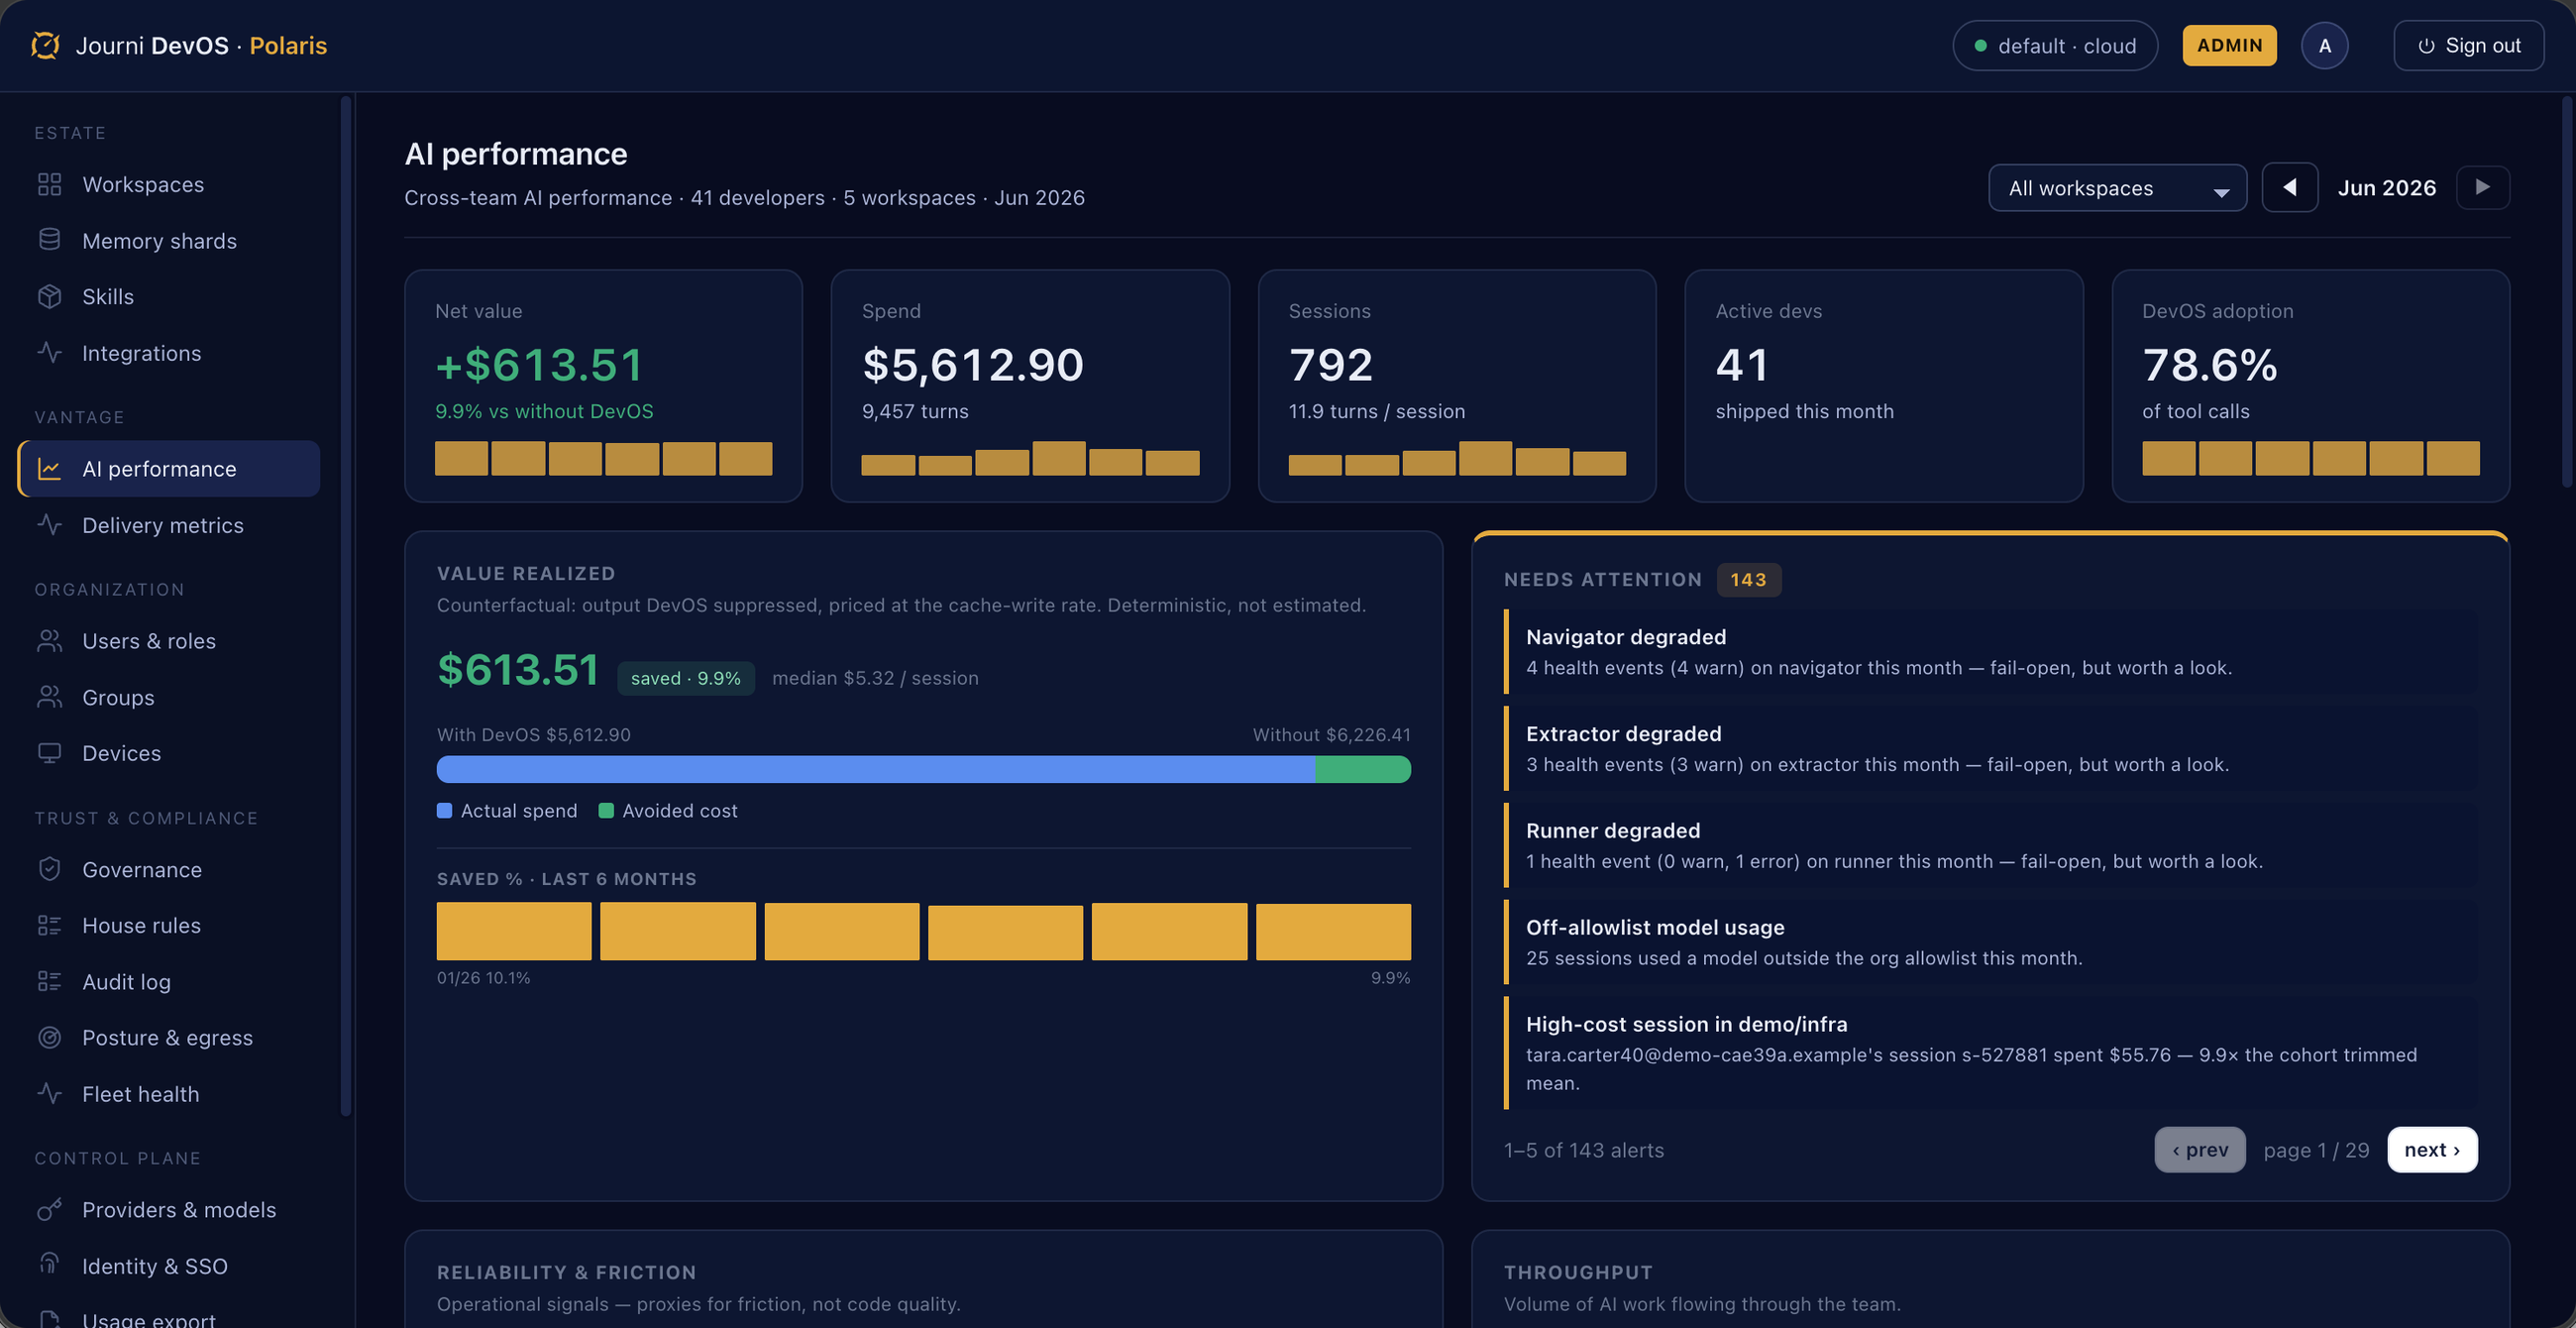
What DevOS returns
Net value and percentage saved each month, per team — priced against your baseline, not estimated.
How much it's used
Sessions, active developers and the share of tool calls on the DevOS layer — the output that follows.
The sessions worth a look
Deterministic rules surface outlier cost, degraded components and off-allowlist use — each with the exact figure.
Prove what AI actually delivers.
Vantage joins your delivery data to its own record of which changes were AI-assisted — so you can see, in your own numbers, what adoption is doing to lead time, deployment frequency and change-failure rate.
Activity isn't delivery
Knowing how much AI is used says nothing about whether it shipped anything faster, or introduced more failures.
Everything's blended
Standard DORA dashboards can't separate the work an agent touched from the work it didn't — so the effect of AI is invisible.
Speed without safety
Going faster only helps if change-failure and restore times hold. Without that, "more AI" is a risk nobody is watching.
The delivery metrics leaders actually track.
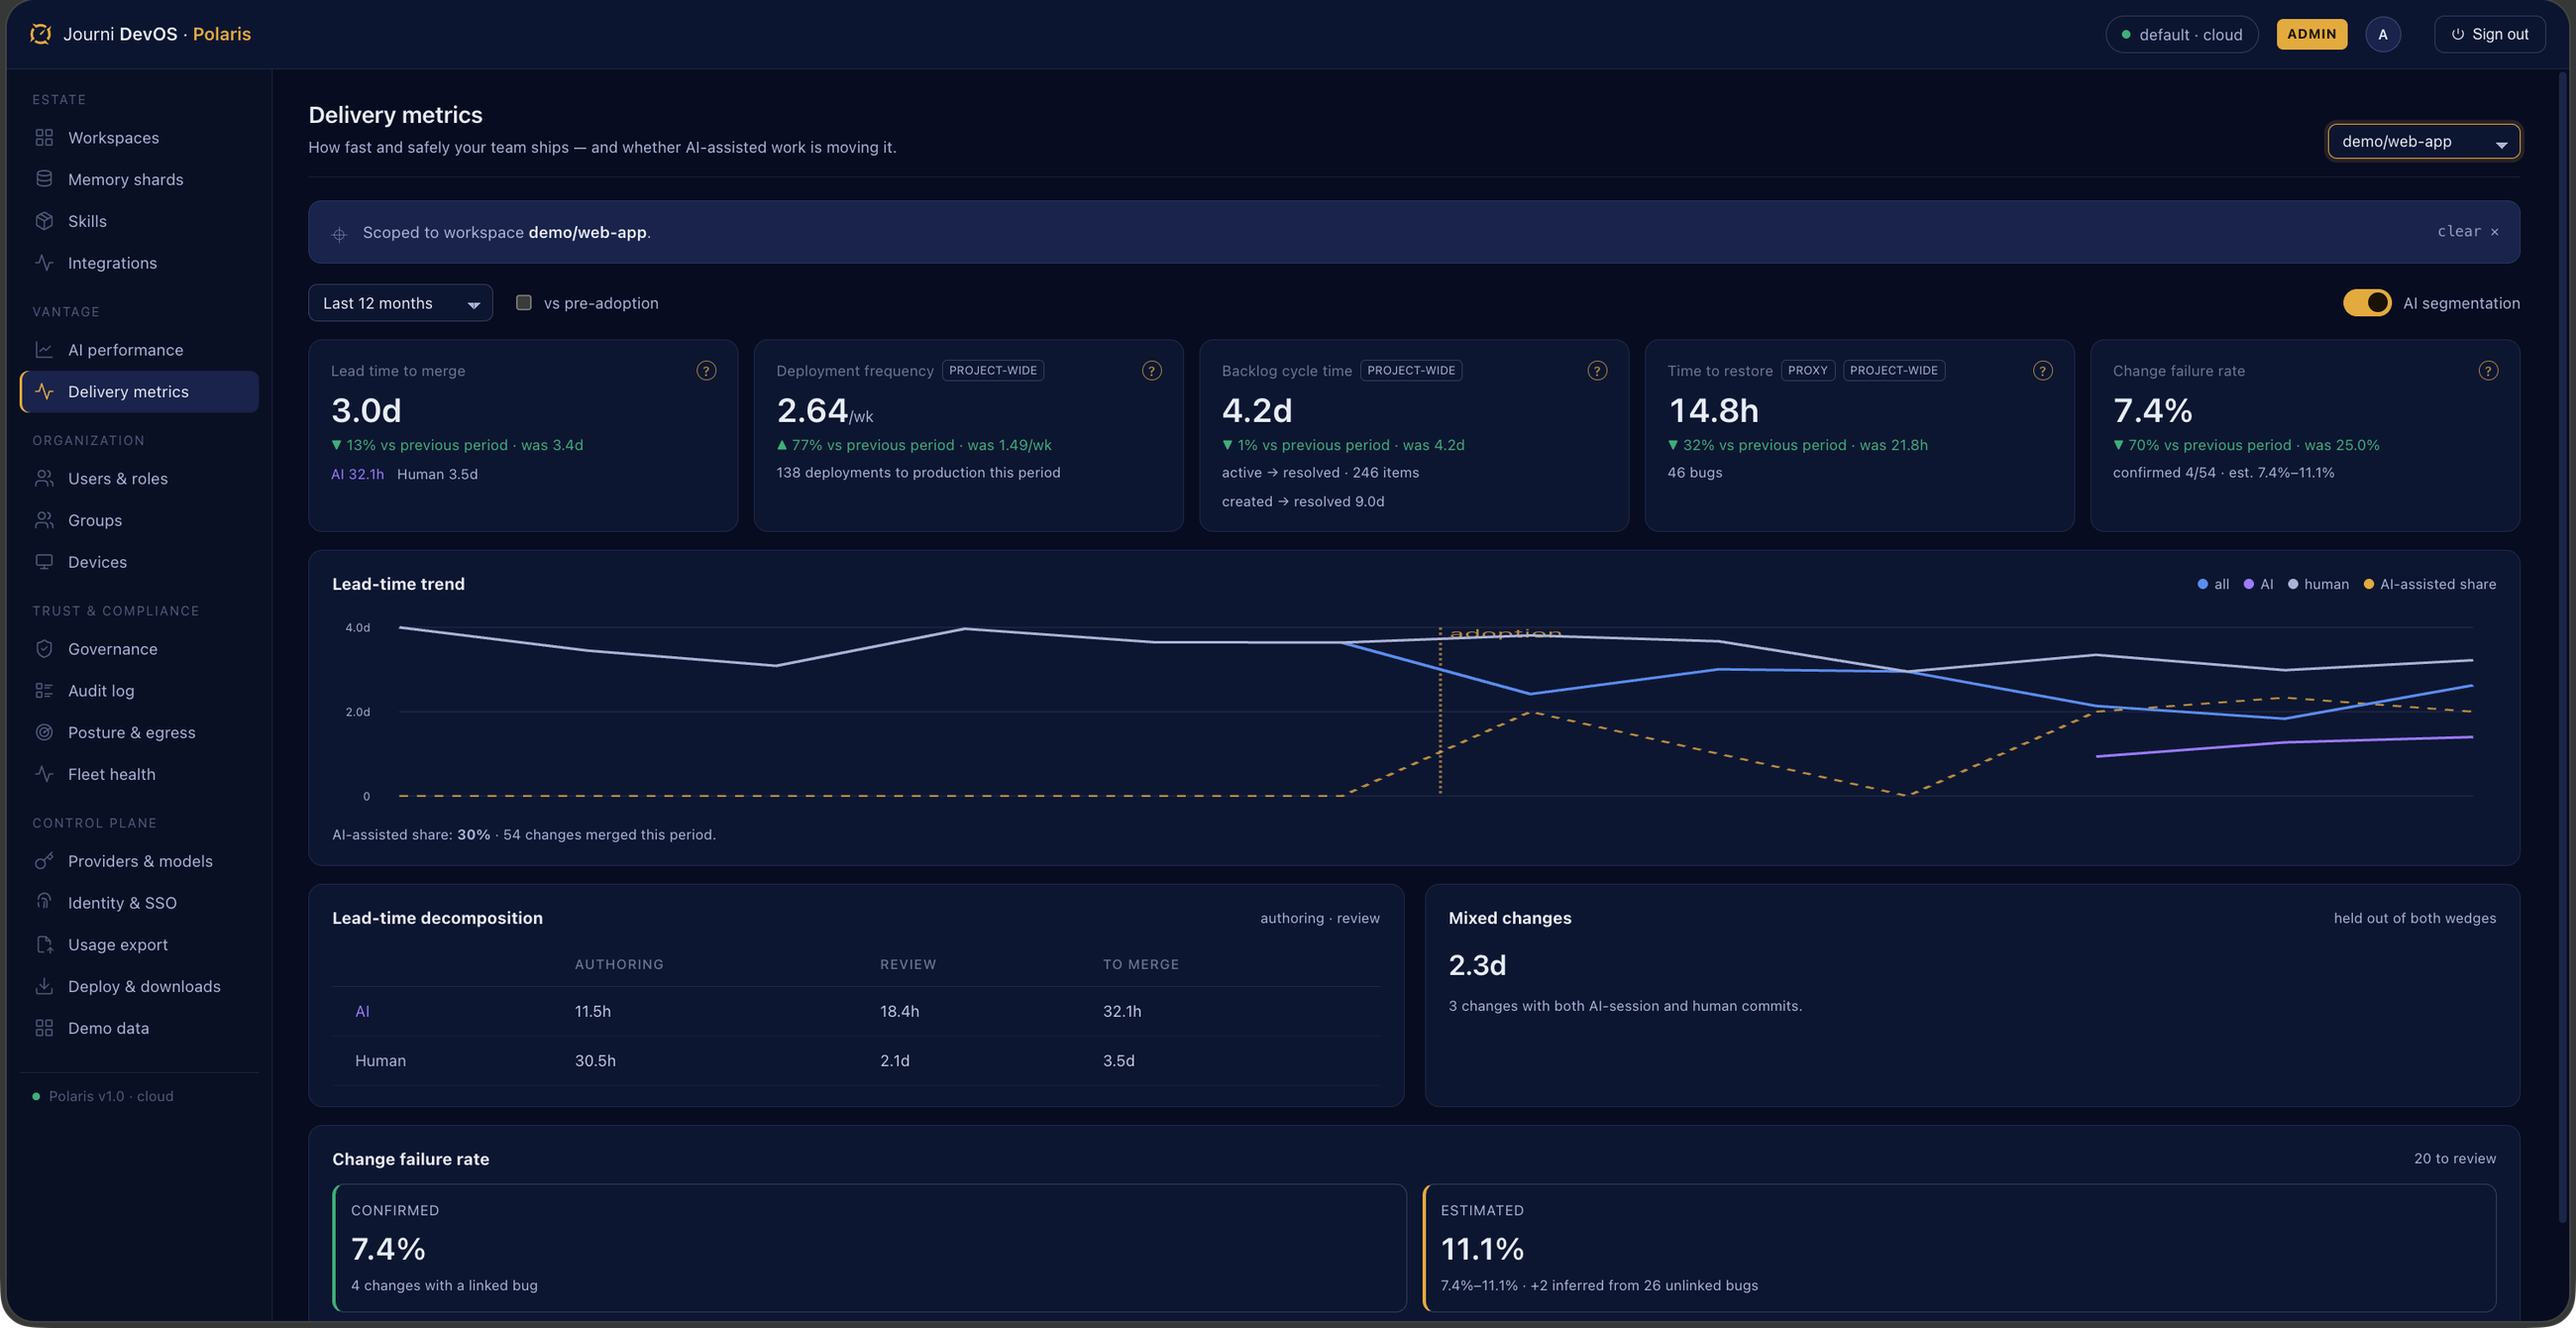
The DORA four, plus the flow metrics teams live by — read against your AI-assisted share over time.
Lead time to production
First commit to live, with the P90 beside the median so a long tail can't hide behind an average.
AI-assisted splitDeployment frequency
How often your changes reach production, and how many of them carried agent-authored work.
Failed production deployment rate
The share of production attempts that failed, read from your pipeline rather than inferred.
Time to restore
How long issues stay open, from your tracker or incident source. Labelled a proxy until an incident source is connected.
Backlog cycle time
How long work items take to go from started to done.
AI involvement
Confirmed and inferred agent authorship, reported as a range with the unknown share shown rather than absorbed.
Split by how much of the work was AI-assisted.
Every change is matched to your Journi DevOS record on its commit SHA, so lead time and review can be read for AI-assisted work separately from the rest. As your AI-assisted share rises, you watch what delivery does — measured against your own baseline, in your own data.
See what AI changed
Read lead time and review for AI-assisted work on its own, next to everything else — so the effect of adoption shows up instead of vanishing into an average.
Measured on your own code
Every metric is set against your own history, on your own commits — numbers you can stand behind, not a vendor's benchmark.
Honest by design
Reported for teams, not individuals, with confirmed problems kept clearly apart from estimates — no single hero number doing the talking.
The Delivery lens.
Your AI-assisted share over time, with the delivery metrics moving beside it — trend-first, period over period.
Every session, analysed for waste and risk.
Alongside the boards, deterministic rules read every session as soon as it finishes and surface the ones worth a look — an outlier-cost session, spend piling on one developer, savings below target, a session lost to errors, a degraded component. Each is flagged with the exact figure. Nothing to set up.
The number for the board — and the loop that keeps it honest.
Bring the evidence to the board
Value, adoption and delivery outcomes in one view, split by AI-assisted work — the evidence to back an AI investment, or to steer it.
Confirm the links
A quick check in Hub: confirm which work item or bug a change belongs to. It takes seconds, and keeps the numbers accurate.
Connect what you have. See what it can prove.
Delivery metrics need your own repos, pipelines and tracker. Journi DevOS reads them — read-only, never writing back — and every connection declares up front which metrics it can support, so a board never shows a number its source can't stand behind.
Azure DevOps & GitHub
Direct API connectors covering pull requests, pipelines and work items from one connection. They supply the pre-merge commits the AI-assisted split needs, so you get the full board: lead time, deployment frequency, change-failure rate and cycle time.
Any source with an MCP server
Point Journi DevOS at a vendor's MCP server and map its tools to the fields we need. You get the metrics that mapping can support — and only those, stated plainly rather than filled in with guesses.
Value & adoption from day one
Savings, spend, sessions, adoption and the needs-attention alerts all come straight from the Journi DevOS ledger. They work from your first pilot, before any delivery source is connected.
Jira is next; GitLab follows. Connections are read-only, sealed in your own custody, and scoped to the repos and projects you choose.
Put a number on what AI returns.
Run a free pilot on your own code and watch value, delivery and adoption — split by AI-assisted work, measured against your own baseline, before any commitment.